Deprivation in Redbridge

The Index of Multiple Deprivation (IMD) is the official measure of relative deprivation for small areas or neighbourhoods in England.

Key facts for Redbridge:

  • Redbridge's rank of average deprivation score has improved from 134th most deprived in England in 2010, to 138th in 2015.  Ranks are based on 326 local authority districts, where 1 is the most deprived and 326 is the least deprived
  • based on the above measure, Redbridge has moved from the 22nd most deprived in London to 21st in 2015
  • Redbridge has 11 neighbourhoods amongst the 20% most deprived in England and another 11 amongst the 20% least deprived in England
  • seven of 21 wards have neighbourhoods amongst the 20% most deprived in England.
  • 6 wards have neighbourhoods amongst the 20% least deprived in England
  • Church End, Monkhams and Snaresbrook have neighbourhoods amongst the 10% least deprived in England
  • every neighbourhood in Loxford is within the 30% most deprived in England
  • every neighbourhood in Clementswood is within the 40% most deprived in England
  • Barkingside, Clayhall and Monkhams are the only wards in Redbridge without any neighbourhoods amongst the 40% most deprived in England
  • this thematic map shows the broad distribution of deprivation across Redbridge in 2010 and 2015

Index of multiple deprivation map


How is IMD calculated?

IMD 2015 ranks every small area or neighbourhood in England from 1 (most deprived area) to 32,844 (least deprived area) and is based on 37 separate indicators, organised across seven distinct domains of deprivation which are combined using the following weights:

  • income deprivation 22.5%
  • employment deprivation 22.5%
  • health deprivation and disability 13.5%
  • education, skills and training deprivation 13.5%
  • barriers to housing and services 9.3%
  • crime 9.3%
  • living environment deprivation 9.3%


What are the small areas?

The small areas or neighbourhoods used are called Lower-layer Super Output Areas (LSOAs), of which there are 32,844 in England.  LSOAs are designed to be of a similar population size with an average of 1,500 residents each. There are 161 LSOAs in Redbridge.

How is IMD used?

National and local organisations use IMD to distribute funding or target resources to areas. It is widely used across central Government to focus programmes on the most deprived areas. Locally, it is often used as evidence in the development of strategies, to target interventions and in bids for funding.

Deprivation breakdown


Key facts for Redbridge:

  • seventeen neighbourhoods in Redbridge are amongst the 20% most income deprived in England, which is significantly fewer than the 40 there were in 2010
  • the number of neighbourhoods in Redbridge amongst the 10% most deprived in England also reduced from 12 to 4
  • the number of neighbourhoods in Redbridge amongst the 20% least deprived in England increased from 10 to 13
  • Loxford continues to have the most income deprived neighbourhood in Redbridge
  • the least income deprived neighbourhood in Redbridge is now in Monkhams, having previously been a neighbourhood in Church End
  • This thematic map shows the broad distribution of income deprivation across Redbridge in 2010 and 2015

Income deprivation map

The Income Deprivation Affecting Children Index (IDACI) is a subset of the Income deprivation domain and measures the proportion of all children aged 0 to 15 living in income deprived families.

Key facts for Redbridge:

  • fourteen neighbourhoods in Redbridge are amongst the 20% most deprived in terms of IDACI in England, which is significantly fewer than the 47 there were in 2010
  • the number of neighbourhoods in Redbridge amongst the 10% most deprived in terms of IDACI in England also reduced from 18 to 3
  • the number of neighbourhoods in Redbridge amongst the 20% least deprived in terms of IDACI in England increased from 11 to 17
  • Fullwell has the most deprived neighbourhood in Redbridge in terms of IDACI (this was previously a neighbourhood in Clementswood)
  • Church End continues to have the least deprived neighbourhood in Redbridge in terms of IDACI, although it is a different neighbourhood to that which was the least deprived in 2010
  • This thematic map shows the broad distribution of deprivation in terms of IDACI across Redbridge in 2010 and 2015

income deprivation affecting children map

The Income Deprivation Affecting Older People Index (IDAOPI) is another subset of the Income deprivation domain and measures the proportion of all those aged 60 or over who experience income deprivation.

Key facts for Redbridge:

  • in contrast to income deprivation and IDACI, 45 neighbourhoods in Redbridge are amongst the 20% most deprived in terms of IDAOPI in England, which is higher than the 37 there were in 2010
  • the number of neighbourhoods in Redbridge amongst the 10% most deprived in terms of IDAOPI in England reduced from 13 to 7
  • there continues to be 7 neighbourhoods in Redbridge amongst the 20% least deprived in terms of IDAOPI in England
  • Loxford has the most deprived neighbourhood in Redbridge in terms of IDAOPI (this is also the most deprived neighbourhood in terms of income deprivation).  This had previously been a neighbourhood in Valentines
  • Monkhams continues to have the least deprived neighbourhood in Redbridge in terms of IDAOPI, although it is a different neighbourhood to that which was least deprived in 2010
  • This thematic map shows the broad distribution of deprivation in terms of IDAOPI across Redbridge in 2010 and 2015Income Deprivation Affecting Older People map

This domain measures the proportion of the working-age population involuntarily excluded from the labour market. This includes people who would like to work but are unable to do so due to unemployment, sickness or disability, or caring responsibilities.

Key facts for Redbridge:

  • ten neighbourhoods in Redbridge are amongst the 20% most deprived in England in terms of employment, higher than the 7 there were in 2010
  • only one neighbourhood in Redbridge is amongst the 10% most deprived in England in terms of employment - this is in Fullwell
  • the number of neighbourhoods in Redbridge amongst the 20% least deprived in England in terms of employment increased from 16 to 21
  • Fullwell has the most deprived neighbourhood in Redbridge in terms of employment (this was previously a neighbourhood in Valentines)
  • Monkhams continues to have the least deprived neighbourhood in Redbridge in terms of employment
  • This thematic map shows the broad distribution of employment deprivation across Redbridge in 2010 and 2015

This domain measures the risk of premature death and the impairment of quality of life through poor physical or mental health.  The domain measures morbidity, disability and premature mortality but not aspects of behaviour or environment that may be predictive of future health deprivation. 

Key facts for Redbridge:

  • only 1 neighbourhood in Redbridge is amongst the 20% most deprived in England in terms of health and disability, which is the same as in 2010
  • there are no neighbourhoods in Redbridge amongst the 10% most deprived in England in terms of health and disability
  • the number of neighbourhoods in Redbridge amongst the 20% least deprived in England in terms of health and disability increased from 22 to 34
  • Loxford has the most deprived neighbourhood in Redbridge in terms of health and disability (this was previously a neighbourhood in Valentines)
  • Snaresbrook has the least deprived neighbourhood in Redbridge in terms of health and disability (this was previously a neighbourhood in Church End)
  • This thematic map shows the broad distribution of deprivation across Redbridge in terms of health and disability in 2010 and 2015 

This domain measures the lack of attainment and skills in the local population.

Key facts for Redbridge:

  • only 1 neighbourhood in Redbridge is amongst the 20% most deprived in England in terms of education, skills and training which is fewer than the two there were in 2010
  • there are no neighbourhoods in Redbridge amongst the 10% most deprived in England in terms of education, skills and training
  • the number of neighbourhoods in Redbridge amongst the 20% least deprived in England in terms of education, skills and training decreased from 50 to 43
  • Hainault continues to have the most deprived neighbourhood in Redbridge in terms of education, skills and training although it is a different one to that in 2010
  • Church End continues to have the least deprived neighbourhood in Redbridge in terms of education, skills and training although it is a different one to that in 2010
  • This thematic map shows the broad distribution of deprivation across Redbridge in terms of education, skills and training in 2010 and 2015

education, skills and training deprivation map

This domain measures the physical and financial accessibility of housing and local services including the physical proximity of local services and issues relating to access to housing such as affordability.

Key facts for Redbridge:

  • fifty-four neighbourhoods in Redbridge are amongst the 20% most deprived in England in terms of barriers to housing and services, which is significantly higher than the 19 there were in 2010
  • the number of neighbourhoods in Redbridge amongst the 10% most deprived in England in terms of barriers to housing and services also significantly increased from 4 to 18
  • there continued to be no neighbourhoods in Redbridge amongst the 20% least deprived in England in terms of barriers to housing and services
  • Roding continues to have the most deprived neighbourhood in Redbridge in terms of barriers to housing and services
  • Church End continues to have the least deprived neighbourhood in Redbridge in terms of barriers to housing and services although it is a different one to that in 2010
  • This thematic map shows the broad distribution of deprivation across Redbridge in terms of barriers to housing and services in 2010 and 2015

This domain measures the risk of personal and material victimisation at local level.

Key facts for Redbridge:

  • fifty-nine neighbourhoods in Redbridge are amongst the 20% most deprived in England in terms of crime, which is higher than the 38 there were in 2010
  • the number of neighbourhoods in Redbridge amongst the 10% most deprived in England in terms of crime also increased from 13 to 22
  • there continues to be no neighbourhoods in Redbridge amongst the 20% least deprived in England in terms of crime
  • Clementswood has the most deprived neighbourhood in Redbridge in terms of crime (this was previously a neighbourhood in Wanstead)
  • the least deprived neighbourhood in Redbridge in terms of crime is now in Monkhams, having previously been a neighbourhood in Snaresbrook

This thematic map shows the broad distribution of deprivation in terms of crime across Redbridge in 2010 and 2015.

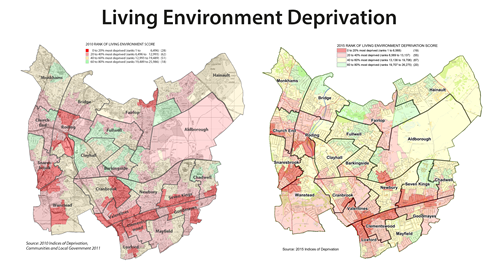
This domain measures the quality of the local environment including the quality of housing, air quality and road traffic accidents.

Key facts for Redbridge:

  • nineteen neighbourhoods in Redbridge are amongst the 20% most deprived in England in terms of living environment, which is much lower than the 28 there were in 2010
  • the number of neighbourhoods in Redbridge amongst the 10% most deprived in England in terms of living environment also reduced from 7 to 4
  • there continues to be no neighbourhoods in Redbridge amongst the 20% least deprived in England in terms of living environment
  • Aldborough has the most deprived neighbourhood in Redbridge in terms of living environment (this was previously a neighbourhood in Clementswood)
  • The least deprived neighbourhood in Redbridge in terms of living environment is now in Fairlop, having previously been a neighbourhood in Monkhams

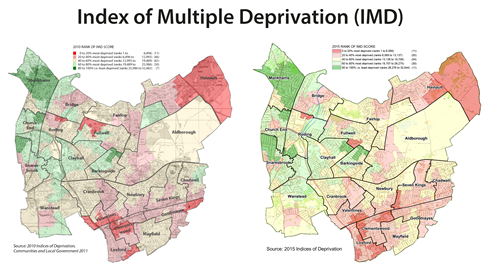
This thematic map shows the broad distribution of deprivation across Redbridge in terms of living environment in 2010 and 2015.